The Linux top command is a versatile and powerful tool that provides an instant overview of system resource usage, performance metrics, and process management. It offers a real-time glimpse into the inner workings of your system, aiding in monitoring and troubleshooting. However, understanding the information presented by top requires some familiarity with the various parameters it displays. This article aims to debunk the top command by breaking down the most crucial metrics it presents.
Table of Contents
Upper Section Metrics: System Overview
The upper section of the top command provides a summary of the system’s overall status:
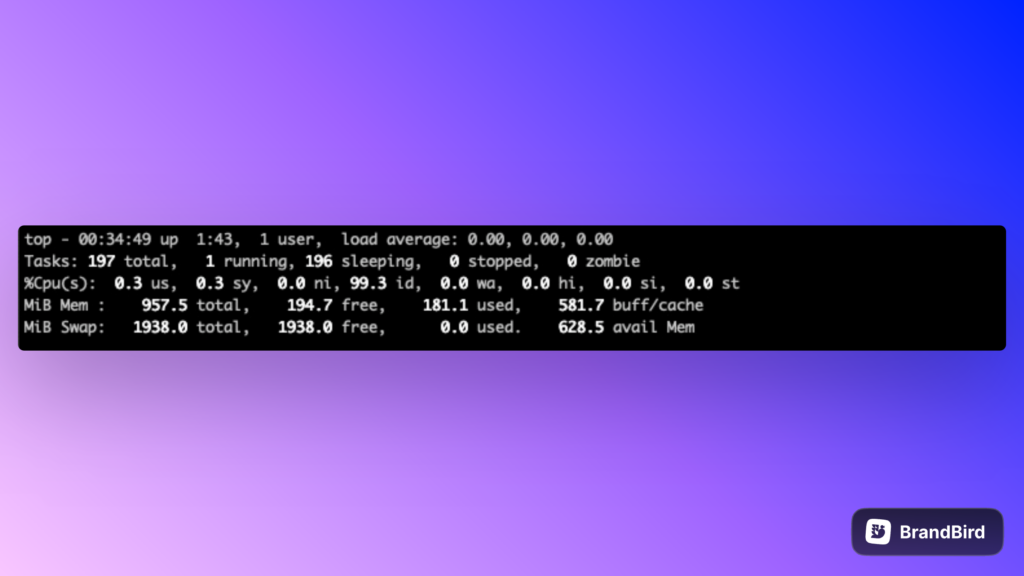
- Uptime: This metric displays the duration for which the system has been running without rebooting.
- User Login: The number of users currently logged into the system.
- Load Average: This value reflects the average workload on the system over different time periods (1, 5, and 15 minutes). It provides insight into whether the system is under heavy load.
- Total Number of Tasks: The total number of processes currently in the system.
- Running, Sleeping, Stopped, and Zombie Tasks: These metrics categorize the current state of processes, helping to identify how many are active, inactive, or stalled.
Memory and Swap Usage Metrics
The next set of metrics pertain to memory and swap usage:
- Total Memory: The system’s total physical memory.
- Free Memory: The amount of memory that is not in use.
- Used Memory: The portion of memory actively utilized by processes.
- Memory Cache: The amount of memory being used as cache to improve system performance.
- Total Swap Memory: The total available swap space.
- Free and Used Swap Memory: Swap memory utilization.
Lower Section Metrics: Process Details
The lower section of the top command displays detailed information about individual processes:
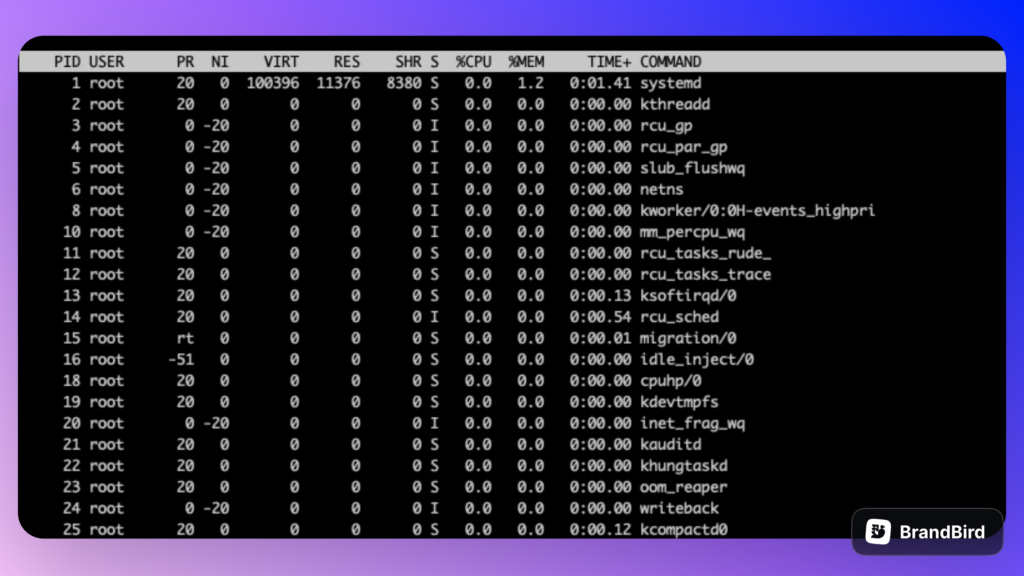
- PID: The unique identification number for each process.
- User: The user account associated with the process.
- Priority (PR) and Nice Value (NI): Process priority and user-adjusted priority, respectively.
- Virtual Memory (VIRT): The total virtual memory used by the process.
- Resident Set Size (RES): The portion of physical memory used by the process.
- Shared Memory (SHR): The amount of shared memory used by the process.
- %CPU: The percentage of CPU utilization by the process.
- %MEM: The percentage of memory utilization by the process.
- Time+Command: The total execution time and the command that started the process.
Important Options of the top Command
- Sorting Processes by Memory Usage (M): To quickly identify memory-intensive processes, press the ‘M’ key. This action rearranges the process list to display the highest memory consumers at the top, aiding in efficient resource allocation.
- Adjusting Refresh Interval (d): By default,
toprefreshes every 3 seconds. If you want to modify this interval, press ‘d’ and enter the desired value in seconds. This flexibility lets you control the update frequency based on your monitoring needs. - Killing Processes (k): In cases where you need to terminate a misbehaving or resource-consuming process, press ‘k’ and input the Process ID (PID) of the process you want to end. This graceful termination helps in resolving system slowdowns and resource bottlenecks.
- Changing CPU View Modes (1, 2, 3, 4, 5, 6): The number keys from 1 to 6 allow you to toggle between different CPU utilization modes. These modes display various combinations of CPUs, helping you monitor multicore systems effectively.
- Renicing Processes (r): Pressing ‘r’ allows you to renice a process. This means you can adjust the priority of an already running process. You’ll be prompted to enter the PID and the new priority value.
- Displaying Threads (H): By pressing ‘H’, you can toggle the display of individual threads associated with processes. This option is particularly useful for understanding how multithreaded applications are utilizing system resources.
- Highlighting Running Threads (z): Pressing ‘z’ will highlight running threads within a process, making it easier to spot the active components of a given process.
- Changing Column Sort (F, O): The ‘F’ key allows you to choose columns for sorting, which can be useful for tracking specific metrics. Pressing ‘O’ lets you dynamically change the sorting order of columns.
- Filtering Processes (o): The ‘o’ key enables you to filter the displayed processes based on specific criteria. This feature helps you focus on relevant processes and their details.
- Setting Priority Colors (z): Pressing ‘z’ toggles color coding based on process priority. This visual cue quickly highlights high-priority processes in the list.
- Displaying Cumulative Time (J): By pressing ‘J’, you can toggle the display of cumulative CPU time for processes. This gives you insights into the historical resource consumption of processes.
- Configuring Interactive Mode (i): Pressing ‘i’ toggles the interactive mode, which hides idle processes from the list. This mode helps declutter the display and concentrate on active tasks.
- Showing Command Line Parameters (c): Press ‘c’ to display the command line parameters used to launch each process. This option can aid in identifying processes and their purposes.
